


Wonderful Introduction:
A quiet path will always arouse a relaxed yearning in twists and turns; a huge wave, the thrilling sound can be even more stacked when the tide rises and falls; a story, only with regrets and sorrows can bring about a heart-wrenching desolation; a life, where the ups and downs show the stunning heroism.
Hello everyone, today Avatrade Aihua Foreign Exchange will bring you "[I'm Aihua Foreign Exchange]: The United States may intervene in the conflict between Iran and Israel! Netanyahu revealed a conspiracy to "assassinate Trump", and the Bank of Japan is about to turn around." Hope it will be helpful to you! The original content is as follows:
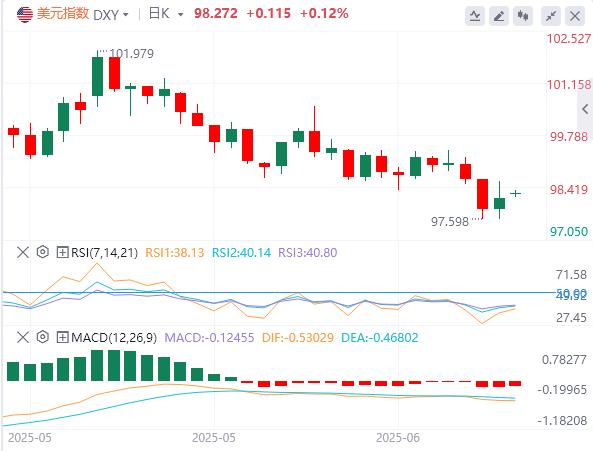
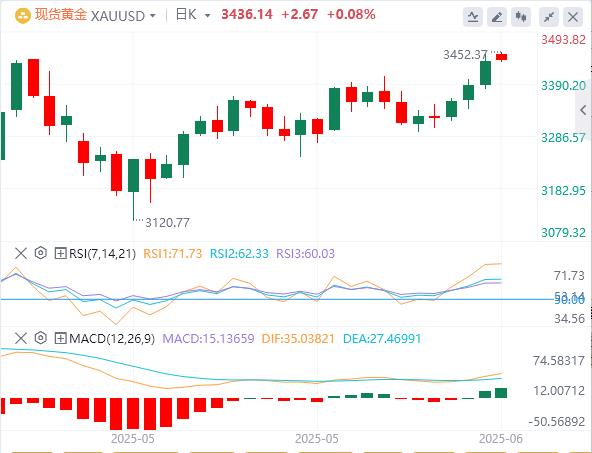
On June 16, early trading in the Asian market on Monday, Beijing time, the US dollar index hovered around 98.27. Last Friday, markets bought safe-haven assets as Israeli attacks on Iran led to a heightened geopolitical tension in the Middle East. The US dollar index rose, regaining the 98 mark and finally closed up 0.31% to 98.14. The benchmark 10-year U.S. Treasury yield closed at 4.4046%, while the 2-year U.S. Treasury yield closed at 3.9580%. Spot gold once stood above the $3440 mark in the early trading, and then maintained a wide fluctuation, finally closing up 1.41%, closing at $3433.35/ounce; spot silver hit the intraday high of 36.62 and then fell back, finally closing down 0.12%, at $36.29/ounce. International oil prices rose sharply due to the tension in Israel and Iran, which has caused investors to worry about the hindrance of oil exports in the Middle East. WTI crude oil once rose more than 13%, the largest intraday increase since 2022, and finally closed up 5.94% to $72.91 per barrel; Brent crude oil once exceeded $76 per barrel, the first time since February 21, and finally closed up 5.85% to $74.38 per barrel.
Analysis of major currencies
Dollar Index: As of press time, the US dollar index hovers around 98.27. The dollar rose against major currencies such as the euro and the yen last Friday, and Israeli attacks on Iran led to intensifying geopolitical tensions in the Middle East, and markets bought safe-haven assets. Markets will focus on Fed's resolution this week, with markets generally expecting the Fed to keep interest rates unchanged, and investors will pay attention to the latest forecasts of the Fed that will reveal the importance of policy makers on recent weak dataand the extent of risks they believe are pending trade and budgetary issues and the intensified conflict in the Middle East. Technically, if the US dollar index returns below the support level of 99.00–99.20, it will move towards the next support level in the range of 96.70–96.90.
Analysis of gold and crude oil market trends
1) Analysis of gold market trends
On the Asian session on Monday, gold trading around 3436.14. The escalating conflict between Israel and Iran has prompted investors to turn to safe-haven assets. In early Asian trading on Monday, gold prices rose 0.6% to above $3,450 per ounce, about $50 away from the all-time high in April. The sudden rise in geopolitical risks has added more momentum to the rise in gold prices, which is driven mainly by the threat of Trump's radical tariff agenda to global economic growth. Gold rose by more than 30% in 2025, and central governmentsThe search for a shift from the US dollar to diversification is another important driving force.
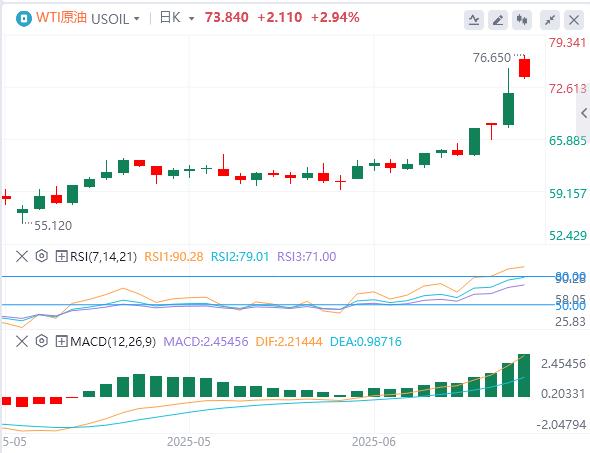
2) Analysis of crude oil market trends
On the Asian session on Monday, crude oil trading around 73.84. As tensions in the Middle East continue over the weekend, oil prices may benefit from geopolitical tensions, with the focus on Iran's retaliation measures, whether they involve the Strait of Hormuz. If relevant aspects are touched, the increase in oil prices may expand sharply, and the US oil price threshold at the beginning of the year may break through rapidly; in addition, the oil market will also usher in the OPEC monthly report next week, and the IEA monthly report is worth paying attention to.
Technical surface: Technical daily chart, last Friday's bullish momentum pushed prices to decisively break through the 100-day and 200-day SMA, enhancing the possibility of further rises. The overlap with the long-term Fibonacci level adds credibility to the breakthrough. The Relative Strength Index (RSI) on the daily time frame is currently at 76, showing an overbought status. However, as the geopolitical background intensifies, fundamental support may eventually overcome short-term weakness. On the weekly chart, WTI broke through $63.29 12-week SMA after Iran’s upgrade with Israel, marking a key shift in sentiment. aihuatrade.comThis surge pushed the price to the 78.6% Fibonacci retracement level of $74.11. The 12-week SMA continues to provide support around $63.31, highlighting the strong foundation for the bulls.
① To be determined OPEC released its monthly crude oil market report
②09:30 Monthly price report on residential prices in 70 large and medium-sized cities in China
③10:00 China's total retail sales of consumer goods in May year-on-year
④10:00 China's industrial added value above scale in May year-on-year
⑤20:30 US New York Fed Manufacturing Index in June
The above content is about "[Ihua Foreign Exchange]: The United States may intervene in the conflict between Iran and Israel! Netanyahu revealed that "assassination of Trump" conspiracy, and the Bank of Japan is about to turn around", which was carefully aihuatrade.compiled and edited by the Avatrade Foreign Exchange editor. I hope it will be helpful to your transactionshelp! Thanks for the support!
After doing something, there will always be experience and lessons. In order to facilitate future work, we must analyze, study, summarize and concentrate the experience and lessons of previous work, and raise it to the theoretical level to understand it.